The GOES X-ray event peaked at 18:37 UT (18:15-18:50 UT).
Clear signatures are seen in the CDS diagnostic raster, taken
in between the fast rasters.
|
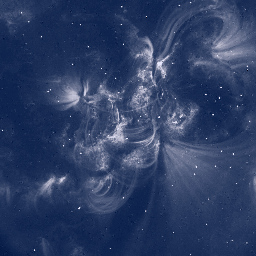
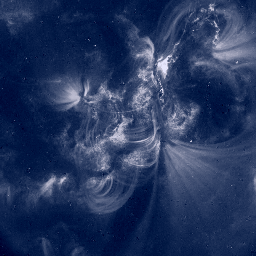
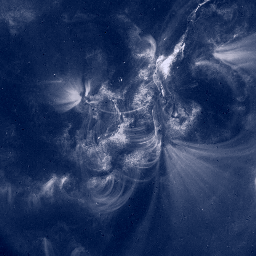
18:25:49 18:31:49 18:41:50 |
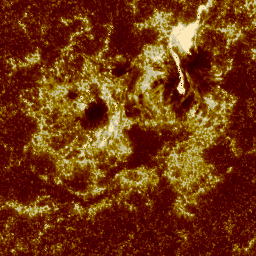
Figure 4: Top: TRACE negative images in the 171 Å filter.
The images are centred at Solar X,Y=233,-296
and have a FOV of 384 arc sec.
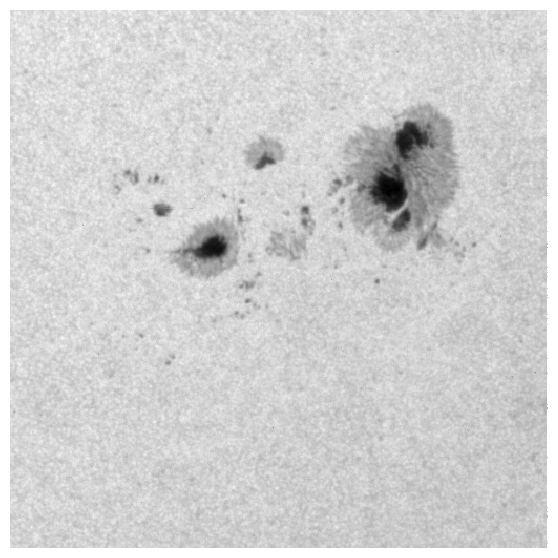
Bottom: TRACE images in white light and in the 1600 Å filter (negative).
The images have a FOV of 256 arc sec.
Figure 5: CDS monochromatic images of April 10th 2001.
Figure 6: TRACE observations of April 10th 2001.
Top: TRACE negative images in the 171 Å filter.
Bottom: TRACE images in white light and in the 1600 Å filter (negative).
Figure 7: CDS monochromatic images of one diagnostic raster
- 2001 Apr 10 18:03-19:27 UT -
A new Fe XIX flare emission appeared in the NW corner,
associated with a GOES C2.7 event
(that peaked at 18:37 UT).
The post-flare TR loop is saturated in O V but not in the
O IV lines, that have been used to derive densities.
Figure 8:
Sequence of CDS monochromatic images and velocity maps
from the fast rasters - 2001 Apr 10 -
Note the Fe XIX flare emission in the NW corner
of the 19:40:04 UT image, associated with the GOES C2.7 event,
still present but more diffuse.
Also note the Fe XIX flare emission in the 21:19:37 UT image,
associated with the GOES C2.4 event that occurred at
21:05 UT.
