|
|
Do not be discouraged by the complexities of any spectrometer, for spectroscopic data have a great diagnostic potential ! I will give as an example a brief overview of the Coronal Diagnostic Spectrometer on-board SOHO.
More information can be found on the CDS main WWW pages:
|
The CDS instrument (Figure 1) consists of a Wolter-Schwartzschild type II grazing incidence telescope, a scan mirror, a set of different slits, and two spectrometers that do not observe simultaneously, the normal incidence spectrometer (NIS) and the grazing incidence spectrometer (GIS).
The slits provide various fields of view (2¢¢×2¢¢, 4¢¢×4¢¢, 2¢¢×240¢¢, 4¢¢×240¢¢, 90¢¢×240¢¢, 8¢¢×50¢¢) and are normally oriented along the solar N-S direction. Note that 1¢¢ corresponds on the Sun to @ 700 km.
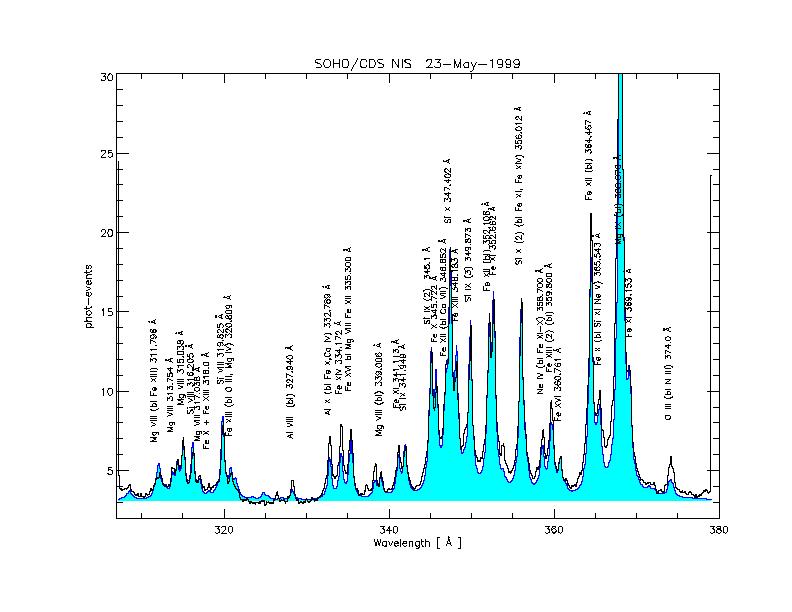
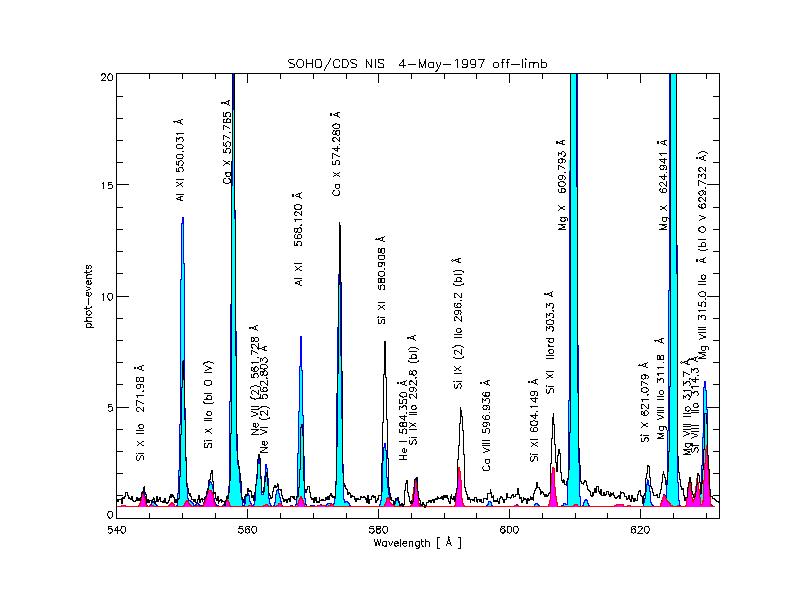
The normal incidence spectrometer (NIS) is composed of two normal incidence gratings that disperse the light into the NIS detector. The gratings are slightly tilted, in order to produce two wave-bands (NIS 1: 308 - 379 Å and NIS 2: 513 - 633 Å;) on the same detector, one on top of the other. The spectral resolution is @ 0.35 Å for NIS 1 and @ 0.5 Å for NIS 2.
The NIS can provide monochromatic images of the solar field of view. This is accomplished with the rastering of a region, moving a mirror and producing contiguous images of one of the long slits. The internal scan mirror and slit movement of CDS allow CDS rasters to cover a maximum area of 4' square within a single raster. The E-W coverage is created by the scan mirror which can move in steps of 2.03". Movement can only be in one direction from West to East.
Telemetry constraints usually make it necessary to pre-select a number of NIS wavelength windows to be extracted on-board from the spectra, before the data are telemetered to the ground.
With any spectroscopic instrument you will have a trade-off between the data you want and those you can telemter. With Solar Orbiter this will be a particularly severe problem.
|
|
|
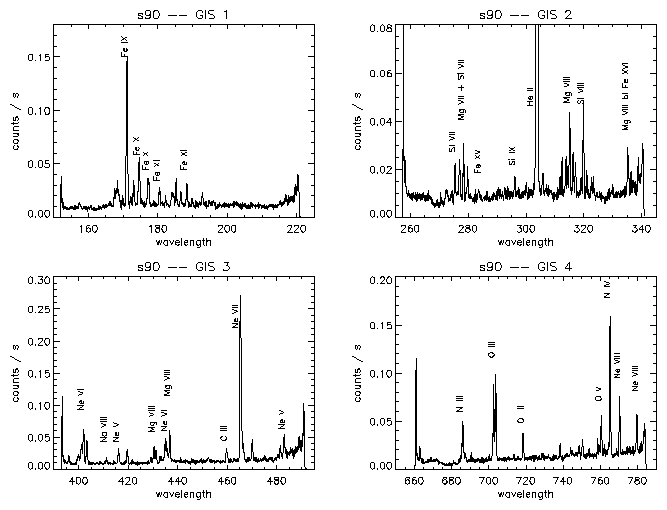
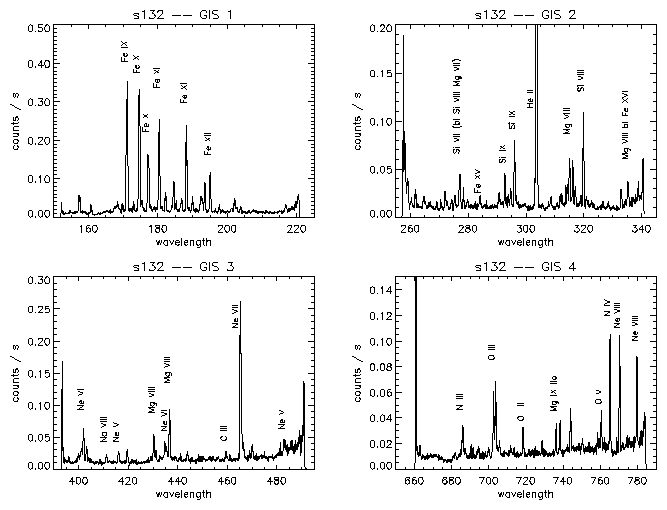
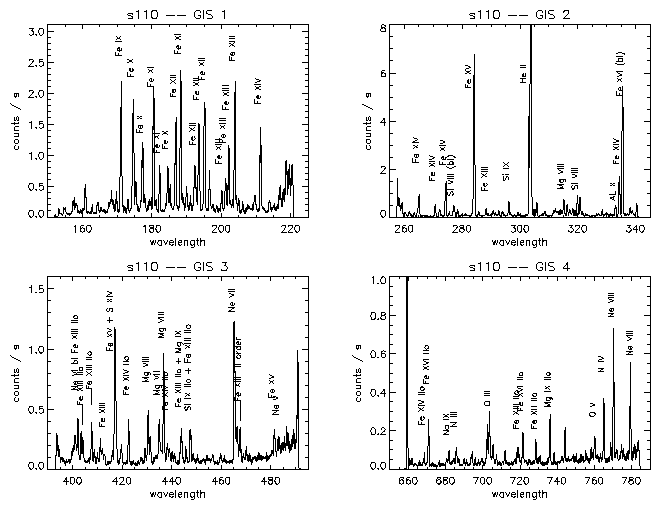
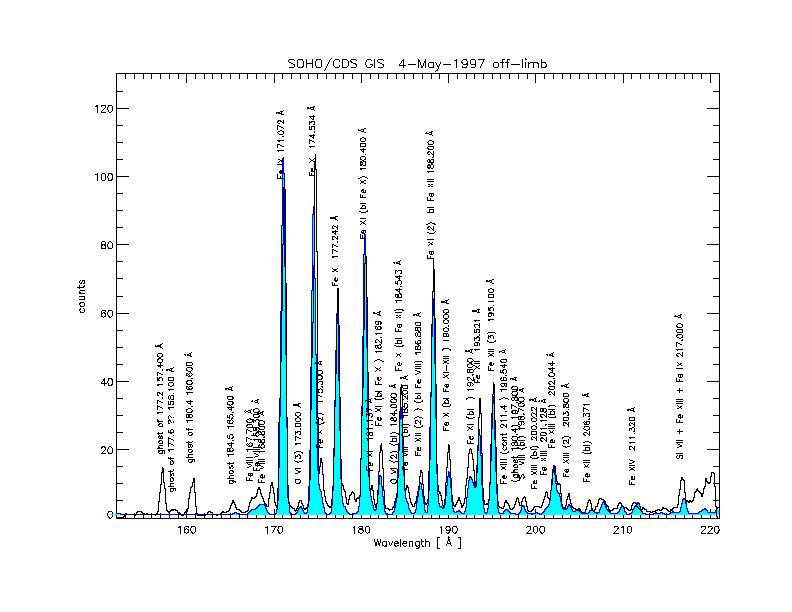
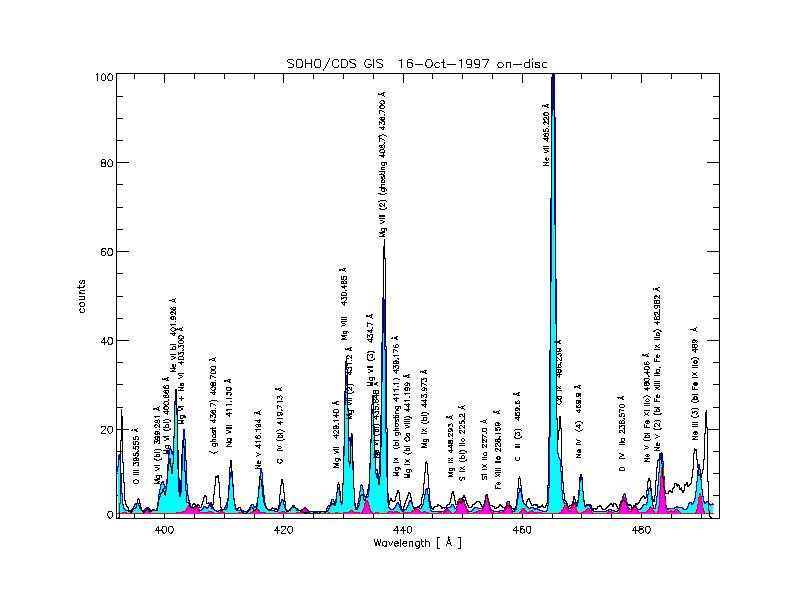
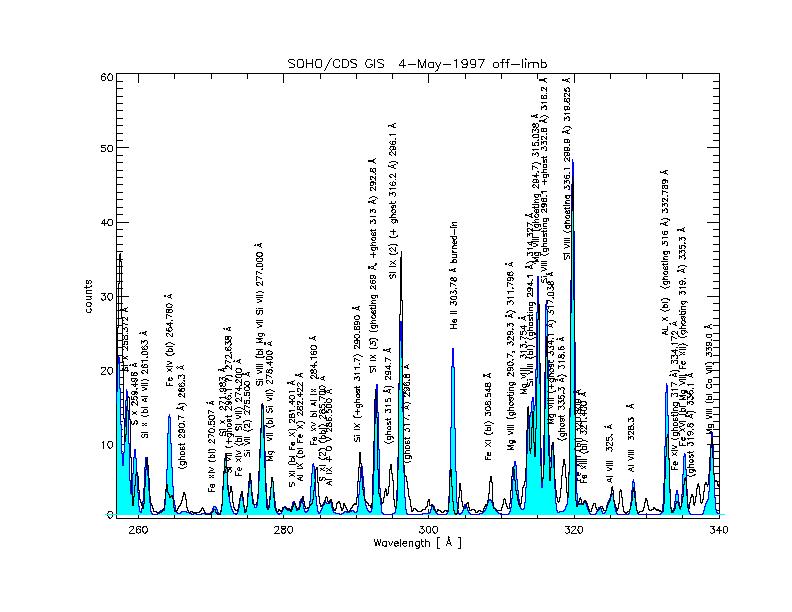
A series of observed spectra (black), with superimposed CHIANTI synthetic spectra (blue +shaded areas), with second order contributions (red +shaded areas) is provided.
|
 |
|
 |
|
 |
|
 |
The grazing incidence spectrometer (GIS) has a grazing incidence spherical grating that disperses the incident light to four microchannel plate (MCP) detectors placed along the Rowland Circle (GIS 1: 151 - 221 Å, GIS 2: 256 - 341 Å, GIS 3: 393 - 492 Å and GIS 4: 659 - 785 Å;).
The spectral resolution of the GIS detectors is about 0.5 Å. Many second order lines have been observed in GIS 3 and GIS 4.
The GIS is astigmatic, focusing the image of the slit along the direction of dispersion but not perpendicular to it.
Images of the Sun are obtained using a pinhole slit and combining movements of the slit and of the scan mirror.
Spectral diagnostics in the EUV |
UNIVERSITY OF CAMBRIDGE Department of Applied Mathematics and Theoretical Physics |
|
2 of 28 |