Illustration of the Proposed Changes to an Academic's Pension
Please Bear With Me
The aim of this page is to illustrate how the proposed changes might affect an academic's pension after a 40-year career and a 20-year retirement. Unfortunately the changes are complicated, so the explanation is not simple. There are two sections below.
- Read the first if you are a current member of the USS, i.e. if you are a member of the final-salary scheme.
- Read the second if you might join USS after April Fool's Day 2011, or if you might re-join USS after April Fool's Day 2011 (e.g. after a period of employment abroad), or if you are worried that it's going to be hard to recruit staff who worry about pensions after April Fool's Day 2011.
[If you find the going tough, you might like to read An Employers' Aim for light, if potentially infuriating, relief.]
Changes to the Final-Salary Pension
As far as future pensions in payment, there are two changes relevant to the members of the USS final-salary scheme (note that there are other changes being proposed as well, but these do not affect future pensions in payment).
- The first is a change from using the Retail Price Index (RPI) to using the Consumer Price Index (CPI) for the uprating of pensions earnt before 31 March 2011.
- The second is a change from using the RPI to CPI for the uprating of pensions earnt after 1 April 2011, but with the added twist that increases to pensions in payment would be subject to a maximum of 5% a year (i.e. the increases would be capped).
The change from RPI to CPI
This change affects all pensions, i.e. both pensions in payment and future pensions. The USS consultation leaflet gets close to suggesting that this change has been imposed by the Government (see page 9 of the leaflet). It is true that in the June 2010 budget, the Government announced that it intended to change increases in, and revaluation of, "official pensions" from being based on the RPI to the CPI. However, the USS is not an official pension; it is only through USS rule 15.1 that the USS Trustees have chosen historically to mirror official pensions.
If HMG's legislation is passed, USS pension increases will in future be uprated with the CPI unless rule 15.1 is changed. However, members should appreciate that there is nothing to stop the USS Trustees changing rule 15.1 to refer to RPI. In the negotiations UCU requested this change, but it was rejected by the employers.
Capping pension increases at 5%
For those who are still in employment after 1 April 2011, pensions earnt before that date will be treated differently to pensions earnt after that date. Once a pension is in payment that part of it earnt before 1 April 2011 will be uprated win line with CPI, but that part of it earnt after 1 April 2011 will be uprated win line with CPI but subject to a maximum 5% increase a year. Such a cap does not have a significant effect in a period of low, or relatively low, inflation (e.g. the period from 1992 to the present day), but can have a significant effect in a period of high inflation (e.g. the 1970s and 1980s).
The final-salary-pension figure

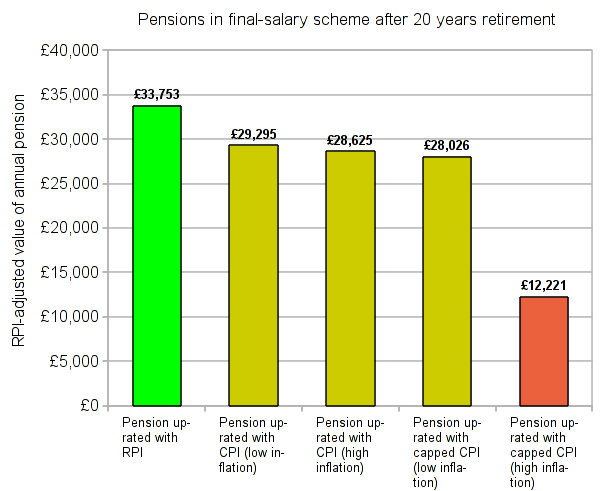
The green bar in the figure above is for a pension, at the end of a 20-year retirement, that has been uprated by RPI (for a more detailed explanation for where the figures come from see the What do the USS pension changes mean? article by Susan Cooper and myself).
The second and third bars are most relevant to someone who is retired or is about to retire. In that case all, or almost all, of the pension payable would be uprated with uncapped CPI. In a retirement of 20 years, the second bar assumes a period of low inflation (similar to 1990-2009), while the third bar assumes a period of high inflation (similar to 1970-1989). In each case the result is a pension in the 21st year of retirement that is about 43% of final salary (i.e. a reduction in pension of about 14%).
The fourth and fifth bars are most relevant to someone who has just started a career. In that case almost all of the pension payable in 40 year time would be uprated by CPI capped at 5%. The fourth bar assumes a for a low-inflation scenario as in the last 20 years and the fifth a high inflation scenario as in 1970-1989. The low inflation scenario results in a pension in the 21st year of retirement that is about 42% of final salary, but the high inflation scenario results in a pension that is only 18% of final salary (i.e. a reduction in pension of about 64%).
The last example demonstrates that a defined benefit scheme that is not protected against inflation does not really give a defined benefit.
The New CARE Pension
The current pension scheme gives members a pension of 1/80th of final salary for each year of contributions, or 50% of final salary for a typical career of 40 years (plus a lump sum of three times the pension). From April Fool’s Day 2011 it is proposed that all new entrants to USS, or most members who rejoin after a break of 6 months or more (e.g. as a result of a period abroad), will no longer be in the final-salary scheme, but in a "CARE" (career average revalued earning) scheme.
One of the difficulties in constructing an illustration is how to include inflation, annual national pay settlements, promotions, etc. It is therefore been necessary to make some modelling assumptions. For details of these assumptions see the What do the USS pension changes mean? article by Susan Cooper and myself.
The comments above both on the change from RPI to CPI, and on the capping of increases to pensions in payment at 5%, are both relevant to the proposed CARE pension. In the nature of a CARE scheme, pensions earnt in a year of employment are revalued annually until retirement. Many might argue that the most natural index to do this would be RPI (since salaries tend to increase at least with RPI, an index that has historically been an average 0.68% higher than CPI). However, USS propose to revalue not simply with CPI, but a capped version: CPI up to 5% a year, plus one half of any excess of the increase in the CPI above 5% a year, subject to a hard cap of 7.5% a year. This strongly affects a model that tracks much of the 1970-1985 period, a period that may have been one of particular financial stress but who would dare say that is not going to happen again!
The CARE pension figure

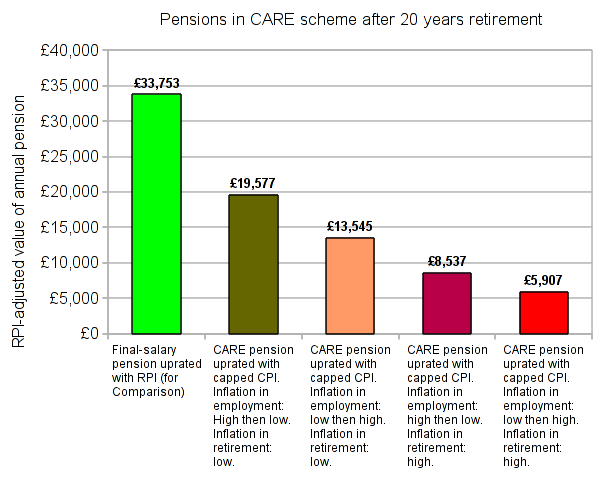
The figure above models the pension of an academic who is steadily promoted during his or her career. For comparison we include the status quo, in that the green bar represents a final-salary pension (uprated by RPI) at the end of a 40-year career followed by a 20-year retirement.
The next four bars represent different inflation scenarios.
- The second bar models, during employment, first a period of high inflation (e.g. 1970-1989), second a period of low inflation (e.g. 1990-2009), followed by a period of low inflation in retirement. This results is a pension in the 21st year of retirement that is about 29% of final salary (i.e. a reduction in pension of about 38% compared with a final-salary pension uprated by RPI).
- The third bar models, during employment, first a period of low inflation, second a period of high inflation, followed by a period of low inflation in retirement. This results is a pension in the 21st year of retirement that is about 20% of final salary (i.e. a reduction in pension of about 60% compared with a final-salary pension uprated by RPI).
- The fourth bar models, during employment, first a period of high inflation, second a period of low inflation, followed by a period of high inflation in retirement. This results is a pension in the 21st year of retirement that is about 13% of final salary (i.e. a reduction in pension of about 75% compared with a final-salary pension uprated by RPI).
- The fifth bar models, during employment, first a period of low inflation, second a period of high inflation, followed by a period of high inflation in retirement. This results is a pension in the 21st year of retirement that is about 9% of final salary (i.e. a reduction in pension of about 82% compared with a final-salary pension uprated by RPI).
These examples again demonstrate that a defined benefit scheme that is not protected against inflation (because it caps increases) does not really give a defined benefit.
